5 Incredible Resources to Support Digital Citizenship
Ten years ago, our partners at Common Sense Media created a Digital Citizenship Week “to highlight the importance of helping kids, families, and teachers navigate our 24/7 digital world.”
A lot has has changed over the last ten years especially over the the past three – classrooms are no longer bound by four walls, learning is taking place anywhere, anytime, and teachers continue to shift instructional pedagogy. Learning is no longer static and is now rich with relevent media and technology, yielding deeper levels of engagement.
In an effort to support these shifts, here are five of the top resources to support teaching and learning about digital citizenship to PK-12 students, teachers, and families throughout the year.
#1 The Achievery
The Achievery, a new, free digital learning platform, leverages interactive lessons designed to teach K-12 students about everything from the consequences of posting on social media to showing kindness online. The lessons feature approved clips from some of the most popular, well-loved movies, TV shows, and cartoons from Warner Bros. Discovery and Cartoon Network.
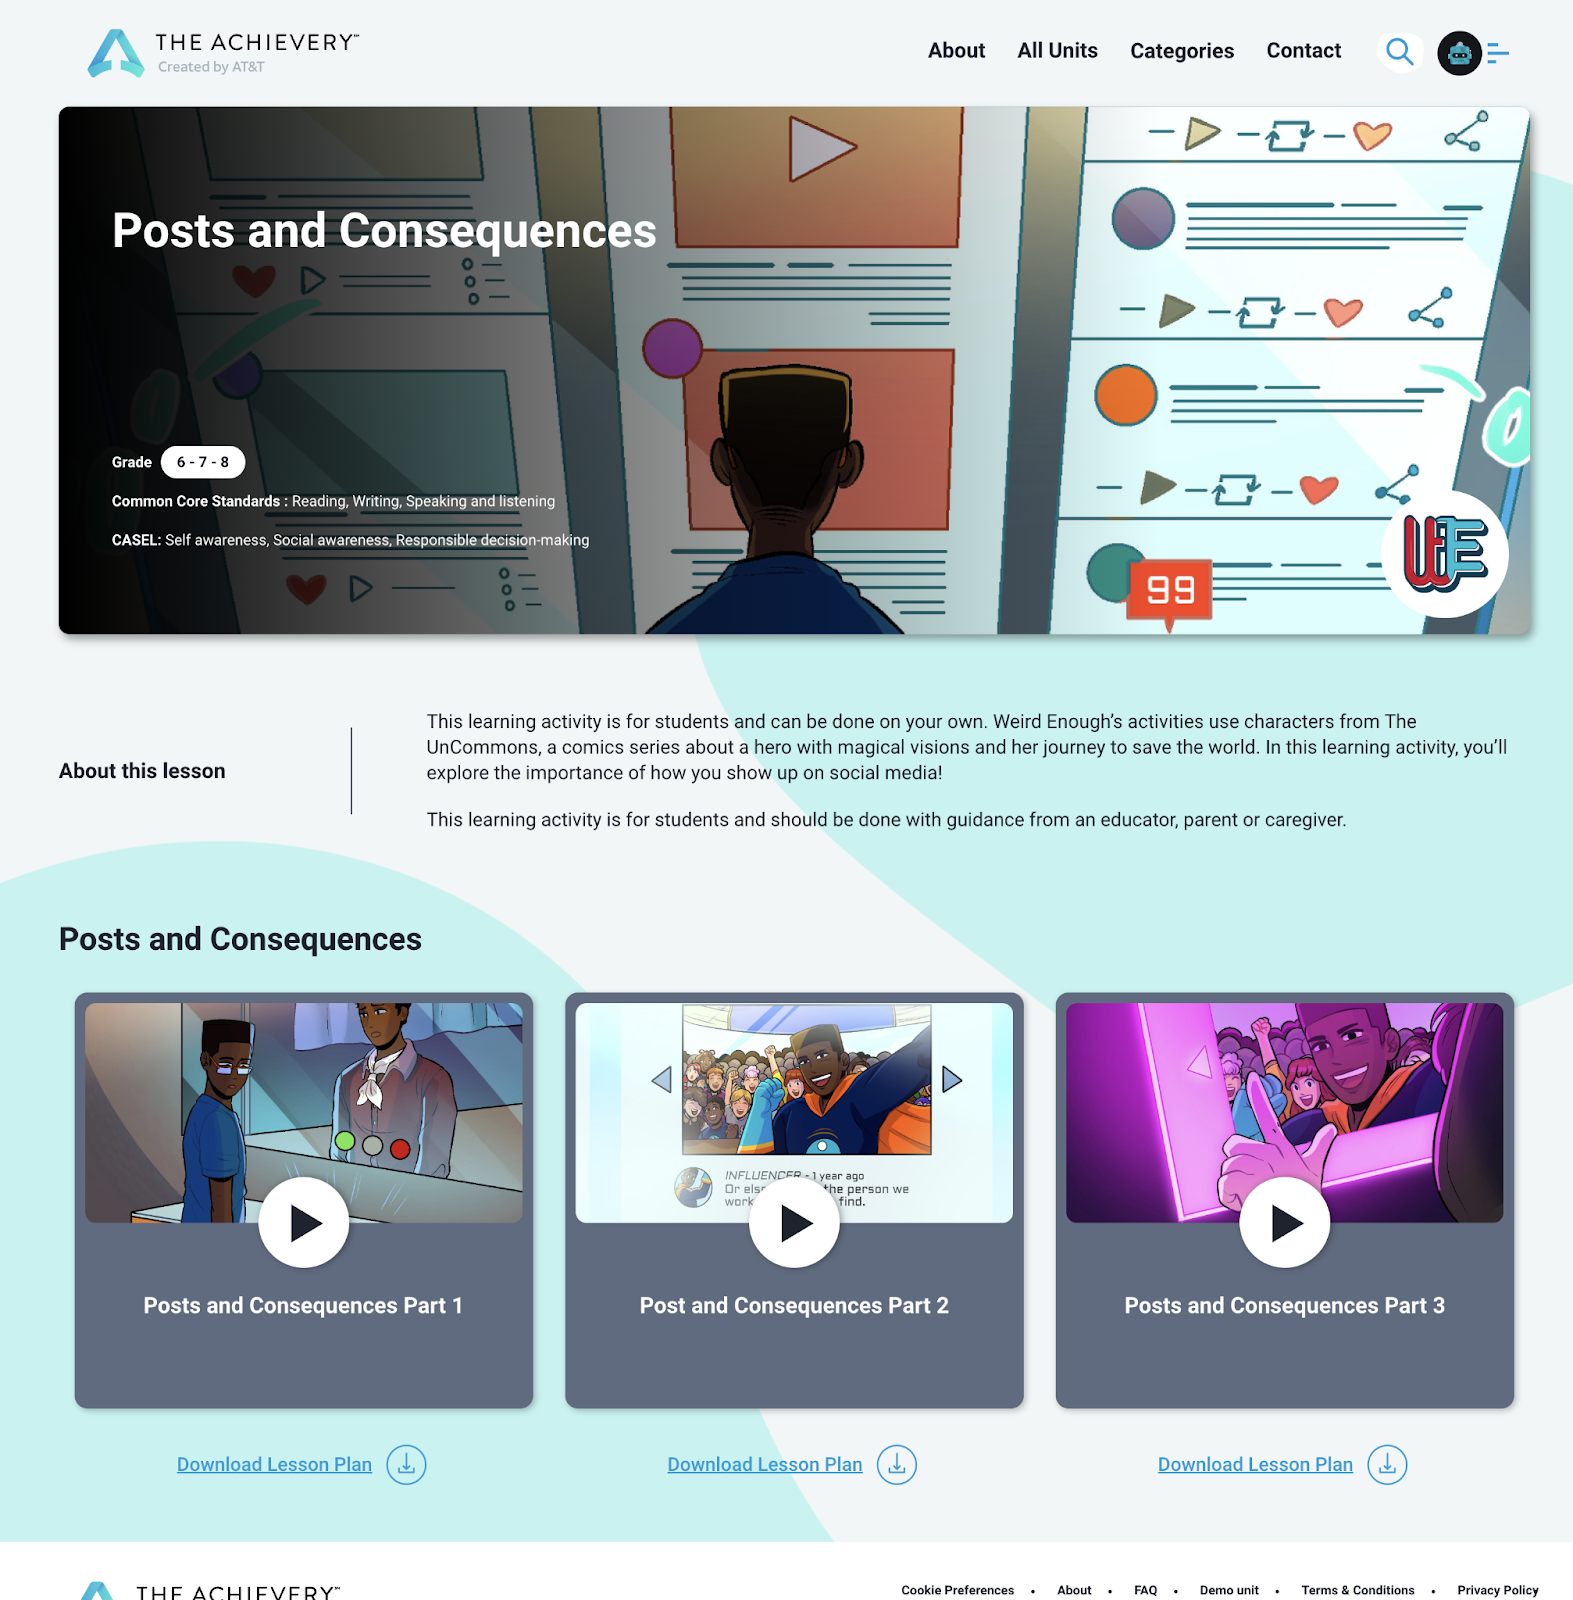
Sign up for The Achievery today! To engage your learners, check out the “units” for digital literacy!
#2 Common Sense Media
Common Sense Media has a free, award-winning digital citizenship curriculum for students K-12 focusing on media balance, online privacy, digital footprint, communication and cyberbullying, new and media literacy and more.
The Common Sense Media K–12 Digital Citizenship Curriculum was designed and developed in partnership with Project Zero at the Harvard Graduate School of Education and guided by research with thousands of educators.
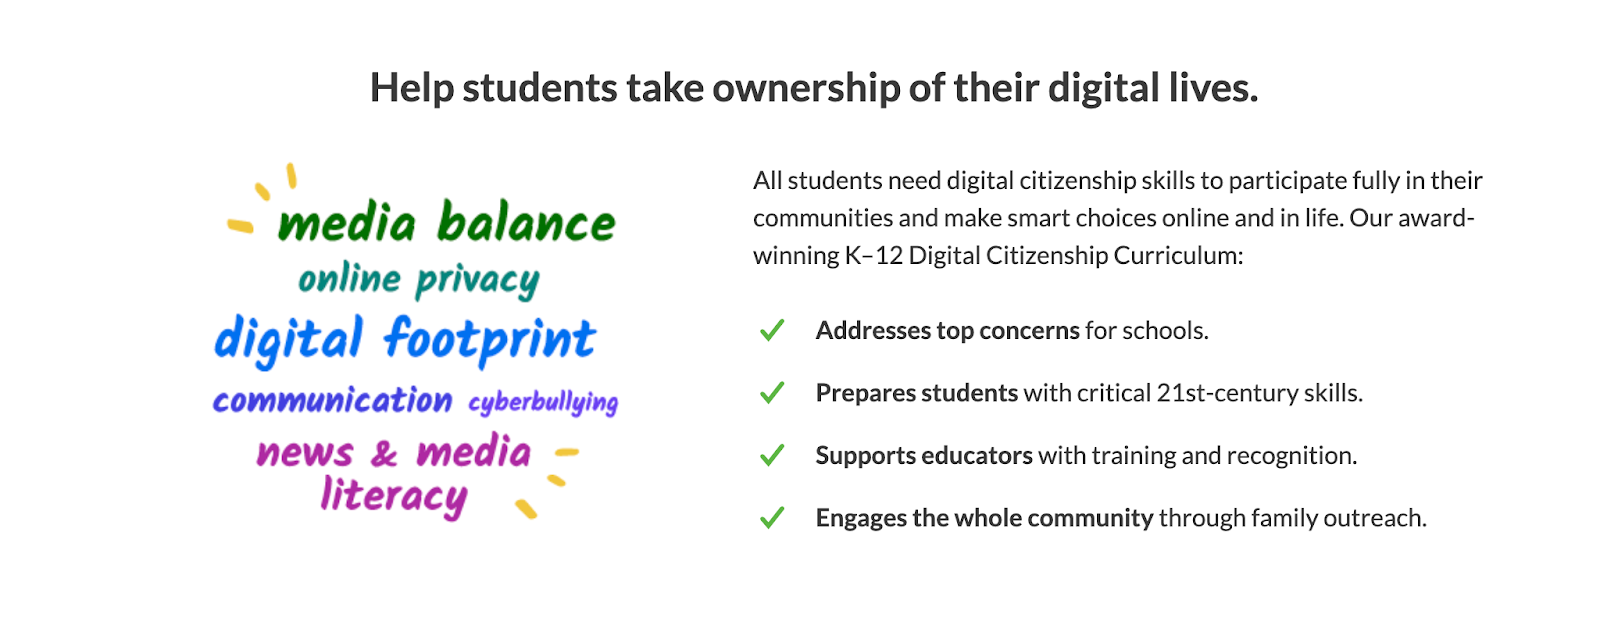
Each lesson in the Common Sense Media K-12 Digital Citizenship Curriculum takes on real challenges and digital dilemmas that students face today, giving them the skills they need to succeed as digital learners, leaders, and global citizens. These ready to teach lessons, along with the online games, is a great way for any teacher or librarian to support digital citizenship all year long.
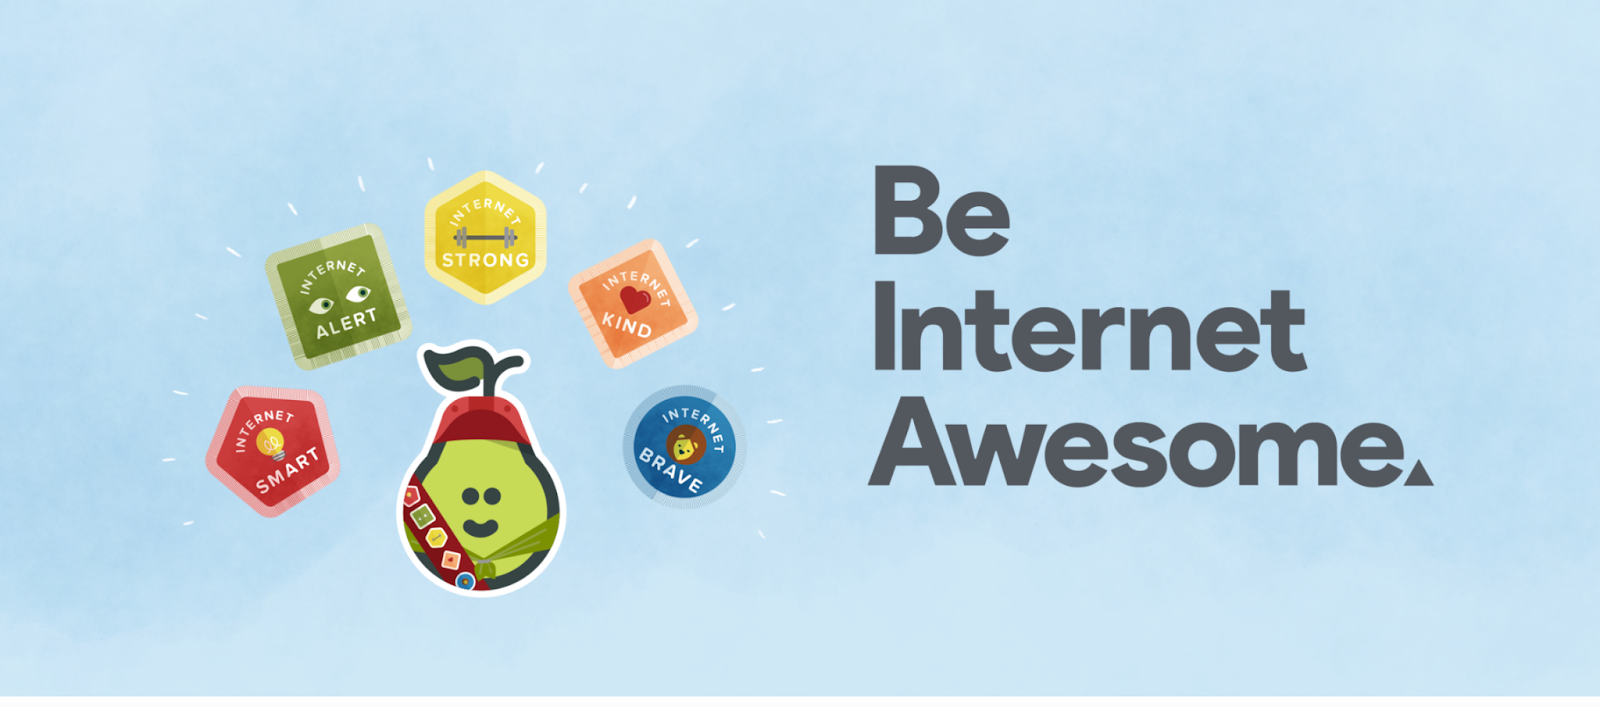
#3 Be Internet Awesome
Be Internet Awesome, a collaboration between Google, The Net Safety Collaborative, and the Internet Keep Safe Coalition, teaches kids the fundamentals of digital citizenship and safety so they can explore the online world with confidence.
[insert video – https://beinternetawesome.withgoogle.com/en_us/]
The Be Internet Awesome curriculum focus on five fundamental topics of digital citizenship and safety including: (1) Share with Care: Digital Footprint and Responsible Communication; (2) Don’t Fall for Fake: Phishing, Scams, and Credible Sources; (3) Secure Your Secrets: Online Security and Passwords; (4) It’s Cool to Be Kind: Combating Negative Online Behavior, and (5) When in Doubt, Talk It Out: Questionable Content and Scenarios.
The lessons are reinforced through Interland, an adventure-packed online game that makes learning about digital citizenship and safety fun.
#4 Pear Deck + Be Internet Awesome
Pear Deck is a great way to teach and support digital citizenship with interactive and collaborative lessons and activities.
In fact, Pear Deck educators worked with Google to create custom, interactive presentations to accompany the Be Internet Awesome lessons mentioned above. Designed for use in the classroom, each presentation provides teachers with a simple way to introduce a concept related to digital literacy and guide students through related activities.
You can also find the vocabulary flashcards for Pear Deck’s Flashcard Factory in the resources here.
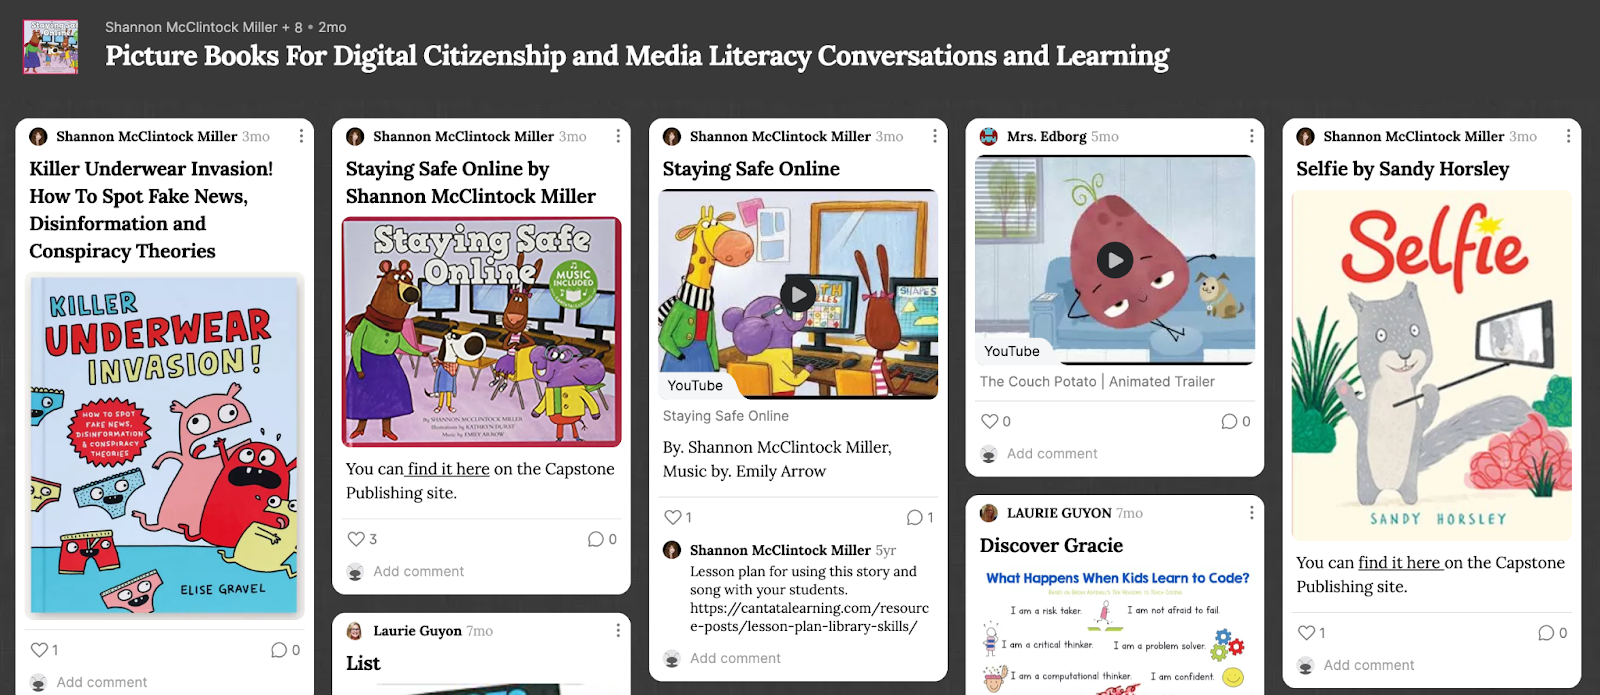
#5 Digital Citizenship Books
There are so many wonderful books that support and celebrate digital citizenship and online topics such as online safety, connecting, social media, technology use and more.
In this Padlet, you will find picture books for digital citizenship and media literacy conversations and learning. Feel free to add other books that tie into these topics to the Padlet!.
The Internet can be a scary place for families to send their children. However, with the proper training, guardrails, and resources, we can help them navigate to a better, safer future.
ABOUT THE AUTHOR
Shannon McClintock Miller is the Future Ready Librarian Spokesperson and District Teacher Librarian, Van Meter Community School (IA) @shannonmmiller and thelibraryvoice.com.
